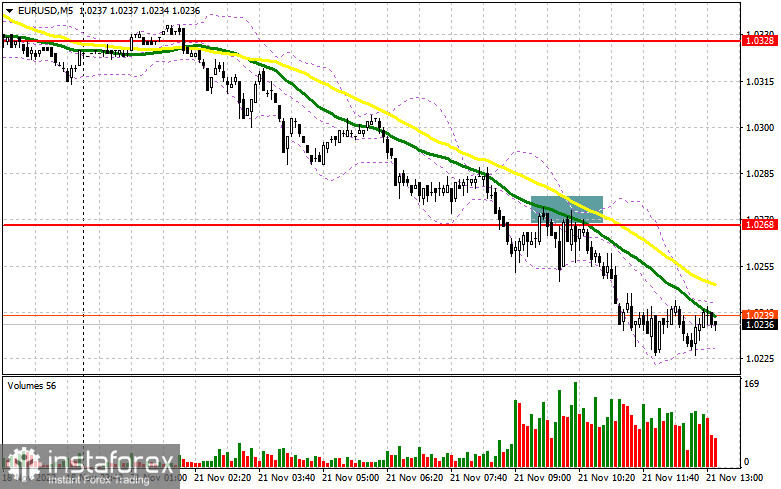
In my morning review, I outlined the level of 1.0268 and recommended entering the market from there. Let's have a look at the 5-minute chart. A breakout and an upside retest of this range coupled with failed attempts of the bulls to regain control created a nice sell signal. By the time of the publication, this move has generated 40 pips in profit. From the technical viewpoint, not much has changed in the second half of the day, including the strategy.
For long positions on EUR/USD:
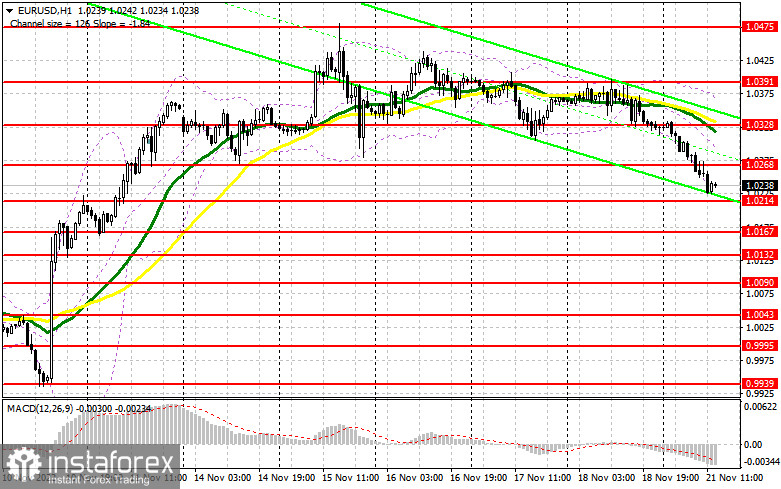
The Chicago Fed National Activity Index which is due to be out in the afternoon is unlikely to support the euro bulls. The most that can happen is profit taking and a slight upside correction by the end of the day. For this, bulls should assert their strength near the support of 1.0214, towards which bears are actively pushing the pair. The best moment to open long positions at this level will be a false breakout which will generate the first buy signal. If so, the pair may start a correction and return to the level of 1.0268 where sellers have been especially active today. A breakout and a downward retest of this range will pave the way to 1.0328 where moving averages supporting bears are located. A move above 1.0328 will open the door to a higher target of 1.0391 where I recommend profit taking. If EUR/USD declines in the North American session and buyers are idle at 1.0214, the euro will come under more pressure and may drop lower. If so, only a false breakout at the support of 1.0167 will be a good moment to open buy positions. Buying EUR/USD after a rebound is possible at 1.0132 or even at the low of 1.0090, bearing in mind an upside correction of 30-35 pips within the day.
For short positions on EUR/USD:
Bears are steadily selling the euro. If the US data turns out to be better than expected, the EUR/USD pair will continue its downward correction. The best moment to sell the pair will be its failed attempt to move above 1.0268, similar to those I described above. This will create a good entry point and will allow the price to move lower to the support of 1.0214. If the pair settles below this level and performs its upward retest, this will create another sell signal that will trigger stop-loss orders set by the bulls. If so, the pair may extend its fall to the area of 1.0167 where I recommend profit taking. The level of 1.0132 will serve as a more distant target, and testing this mark may cancel the bullish trend. In case EUR/USD rises in the course of the North American session and bears are idle at 1.0268, speculative sellers will start leaving the market. This will strengthen the upward correction and will pave the way to 1.0328. Selling at this pound can be done only after a false breakout. Going short on EUR/USD right after a rebound is possible at the high of 1.0391, keeping in mind a downward intraday correction of 30-35 pips.
COT report
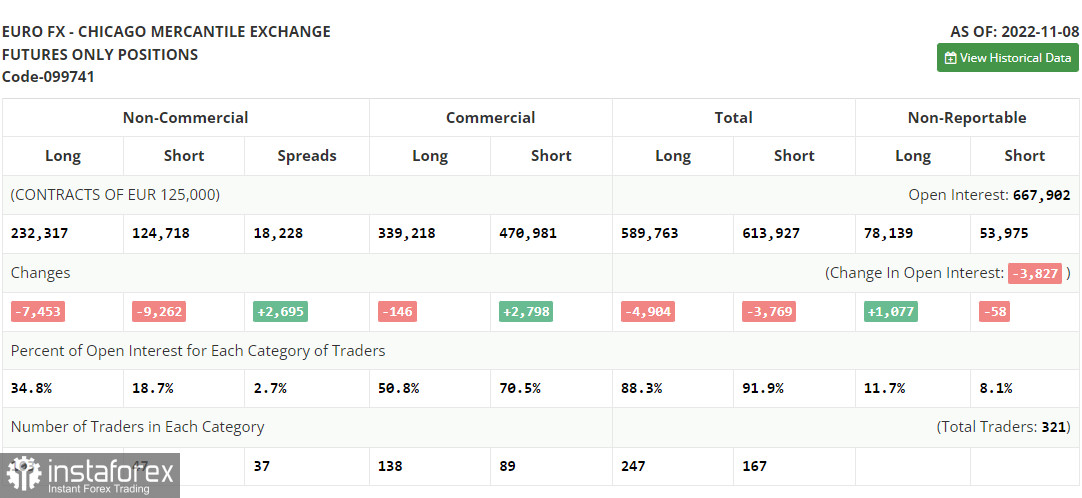
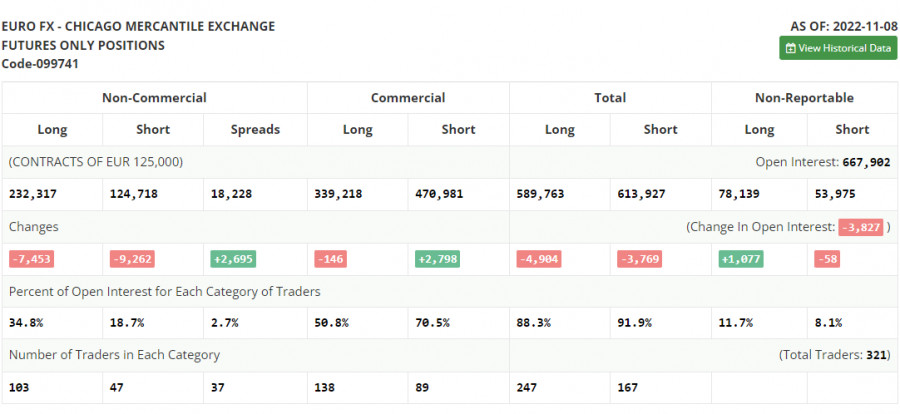
The Commitments of Traders report for November 8 showed a drop in both short and long positions. This report does not reflect the reaction to the recent US CPI data so it should not be fully trusted. Despite a slowdown in US consumer prices, and we are talking about a slowdown and not a proper decline, the US Federal Reserve will continue to hike rates. It is expected that the rate increase in December will be between 0.5% and 0.75%. As for the euro, the demand for risk assets has indeed increased. Apart from speculations that the Fed is going to ease the pace of monetary tightening, the euro is driven by the ECB's plan to maintain the rate-hiking cycle. More and more EU officials are saying that borrowing costs should be increased further in order to tackle rising inflation. However, if the EU economy continues to contract at a rapid pace, the regulator may give up the idea of aggressive monetary policy. This will definitely limit the upside potential of the pair in the medium term. According to the COT report, long positions of the non-commercial group of traders dropped by 7,453 to 232,317 while short positions declined by 9,262 to 124,718. The non-commercial net position remained positive at 107,599 versus 105,790 a week earlier. This indicates that investors are taking advantage of a cheaper euro and continue to buy it while it is holding below the parity level. They might also be accumulating long positions in hope that the pair will start to recover sooner or later. The weekly closing price advanced to 1.0104 from 0.9918.
Indicator signals:
Moving Averages
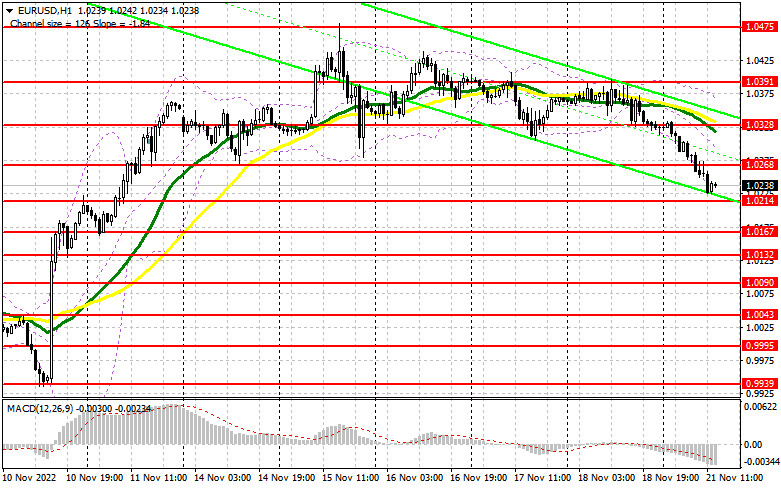
Trading below the 30- and 50-day moving averages indicates that the euro is set to decline further.
Please note that the time period and levels of the moving averages are analyzed only for the H1 chart, which differs from the general definition of the classic daily moving averages on the D1 chart.
Bollinger Bands
If the pair advances, the upper band of the indicator at 1.0375 will act as resistance.
Description of indicators:
• A moving average of a 50-day period determines the current trend by smoothing volatility and noise; marked in yellow on the chart;
• A moving average of a 30-day period determines the current trend by smoothing volatility and noise; marked in green on the chart;
• MACD Indicator (Moving Average Convergence/Divergence) Fast EMA with a 12-day period; Slow EMA with a 26-day period. SMA with a 9-day period;
• Bollinger Bands: 20-day period;
• Non-commercial traders are speculators such as individual traders, hedge funds, and large institutions who use the futures market for speculative purposes and meet certain requirements;
• Long non-commercial positions represent the total number of long positions opened by non-commercial traders;
• Short non-commercial positions represent the total number of short positions opened by non-commercial traders;
• The non-commercial net position is the difference between short and long positions of non-commercial traders.